The 2022 Top Contractor results are in and the numbers show an increase in sales from last year, but a decrease in entries, and there could be multiple reasons why.
One, a shift in resources on our end could have caused the entries to not reach as many contractors as normal. Two, you guys are just BUSIER this year and did not have time to fill out the form. This is great news for you all - and accounts for the increase in sales volume - but it’s not great for our list size.
Because of this, our lists dropped from the Top 75 companies to the Top 50 this year and we hope we can get back up to 75 companies who qualify for each category again next year . There just were not enough qualifying entries to make a Top 75 lists. What this unfortunately means is that many companies who made our lists last year, did not qualify for the Top 50 lists this year and that’s tough. Spread the word next year and let’s make sure we get more entries. Please know that we appreciate your efforts and the time you spent filling out the form. Keep up the great work!
For the 2022 Pavement Top 50 Contractors, total sales dollars were up significantly, meaning the industry is rebounding at a breakneck pace. In the links below, we break down these numbers with an overview of the Paving 50, Sealcoating 50, Striping 50 and Pavement Repair 50 for 2022 - along with industry insights resulting from the information these companies provide.
View the Paving Top 50 Here.
View the Striping Top 50 Here.
View the Sealcoating Top 50 Here.
View the Pavement Repair Top 50 Here.
Overall Sales Dollars
We start with overall sales dollar of the qualifying contractors which reached more than $1.674 billion. Compare that to the to $1.096 billion last year and $1.316 billion in 2020, that is a significant bump, even with 25 less companies on the list.
That overall sales number represents the combined total of only paving-only, sealcoating-only, striping-only, and repair-only sales – in other words the sales figures
All lists saw an increase in total sales of all work completed. That is huge considering there are 25 less companies on the list, but more total profit.
- Paving 50: $1.337 billion total sales compared to $1.336 billion last year
- Striping 50: $1.132 billion total sales compared to $890 million last year*
- Sealcoating 50: $1.61 billion total sales compared to $930 million last year
- Pavement Repair 50: $1.22 billion total sales compared to $1.061 billion last year
There was also an increase in segment-only sales as well.
- Paving-only sales increase to $742,226,477 from $681 million last year
- Striping-only sales increased to $150,346,312 from $108 million last year*
- Pavement Repair-only sales increased $247,572,610 from $206 million last year
If we look back at last years list, the sales volume of contractors took a huge leap as 25 more contractors were joining the list. 2021 sales (which is the base for the 2022 Top Contractors List) were up significantly across the board as the economy started to rebound and contractors started to reap the rewards from the pent-up demand 2020 left behind. We will be interested to see how sales look next year given the economy and the supply chain woes wreaking havoc on our industries.
*We are verifying financials of one large striping contractor who entered the list this year, which could have skewed results.
View the Paving Top 50 Here.
View the Striping Top 50 Here.
View the Sealcoating Top 50 Here.
View the Pavement Repair Top 50 Here.
The "Average" Top 50 Contractor
Considering all the companies participating in this year's survey, the average contractor generates just over $23 million in annual sales ($14 million last year and $22 million in 2020) from a diversified mix of paving and pavement maintenance work. The average revenue by segment breaks down this way:
- Paving: 62% (59% last year)
- Striping: 18% (19%)
- Sealcoating: 25% (24%)
- Pavement Repair: 19% (18%)
- Sweeping: 3% (4%)
- Other: 11% (11%)
Concrete work is the most-common service cited in the "other" category, which also includes surface treatments, hot mix asphalt production, drainage, traffic control, landscaping or snow removal and sports courts.
The average company works 69% of its time on parking lots, 19% on streets, 11% on driveways, 5% on highways and 2% on other (paths, courts, signage, concrete flatwork).
As for the customers this average contractor works for:
- 57% are commercial clients
- 15% are municipal (state/local agency) customers
- 20% are multi-family properties
- 9% are single family homeowners
- 2% is "other" which is a mix of general contractor, sports courts, paths and farms
The average contractor generates 24% of revenue (27% last year) from work as a subcontractor.
Other Findings
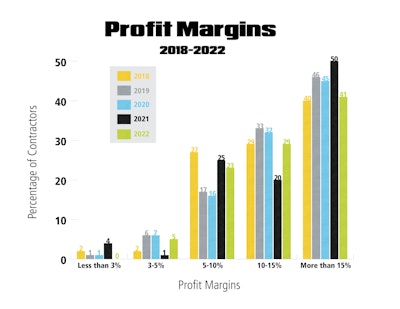
Overall Profit Margins - We’ll report profit margins for each industry segment in the introduction to each segment on the following pages, but the chart on this page provides a look at the overall range of profit margins for all companies responding to the survey, whether they qualified for a list or not.
As the chart shows, there continues to be a broad range of profit margins with which contractors are working. We fully expected profit margins to take a hit this year as it’s getting more difficult each day to get the work done with labor and supply prices dramatically increasing. However, it was good to see that everyone at least made some profit last year and margins are, for the most part, remaining steady.
- 0% of respondents indicated they earn less than 3% margin (4% last year)
- 4.8% reported margins in the 3%-5% range (1% in 2021 and 7% 2020)
- 22.9% report margins in the 5%-10% range (25% in 2021 and 16% in 2020)
- 28.9% of respondents indicated they earn 10%-15% profit margin (20% in 2021 and 32% in 2020year)
- 41% report margins greater than 15% (50% in 2021 and 45% in 2020)
Replacement Value of Equipment - While the pavement maintenance business has been viewed as an industry with a low-cost barrier to entry, particularly in the sealcoating, striping and possibly repair segments (though few contractors start out as “repair specialists”), the contractors that make up these lists have significant investments in their fleets. Survey results indicate that:
- 11% could replace their fleet for less than $250,000
- 11% for between $250,000-$500,000
- 14.5% for between $500,000-$1 million
- 19.5% for between $1 million-$2 million
- 44% for more than $2 million
Number of Jobs - Last year, 40% of contractors reported working on 400 or more jobs. This year, that number is up with 45% of contractors working on 400 or more jobs in a year. The hustle really was strong in 2021, which is perhaps the reason profit margins remained steady. The rest of the results are below.
- 11% perform less than 100 jobs (15% in 2021)
- 16% perform between 101-150 jobs (15% in 2021)
- 8.5% perform between 151-200 jobs (9% in 2021)
- 11% perform 201-300 jobs (13% in 2021)
- 8.5% perform 301-400 jobs (8% in 2021)
- 45% perform more than 400 jobs (44% in 2021)
Number of Customers. The number of customers contractors perform those job for indicates they often obtain multiple projects from the same customer – a good sign for those pursuing relationship-building as a means of growth. This might also mean that one contractor can complete a wide variety of services for that one customer, diversifying their operation to become a "one-stop shop". Over a quarter of contractors participating in the survey (28%) work for fewer than 100 customers, while 23% work for more than 400 customers.
- 28% work for fewer than 100 customers
- 12% work for between 101-150 customers
- 10% work for 151-200 customers
- 15% work for 201-300 customers
- 10% work for 301-400 customers
- 23% work for more than 400 customers
View the Paving Top 50 Here.
View the Striping Top 50 Here.
View the Sealcoating Top 50 Here.
View the Pavement Repair Top 50 Here.
Data analysis completed by Nick Raether, AC Business Media Vice President of Operations & IT.


